Essential Metrics for a Thriving SaaS Business
November 29, 2023 | Read Time : 3 mins
Table of Contents
SaaS businesses which are built on recurring revenue models and customer satisfaction reigns supreme, here, tracking key metrics is not just an option; it’s a necessity. These metrics serve as invaluable compass points, providing businesses with the insights they need to navigate the path to success.
By regularly monitoring and analyzing these metrics, SaaS companies can identify areas for improvement, optimize strategies, and make informed decisions that drive growth and ensure long-term sustainability. Let’s delve into some of the key SaaS metrics that every business should be tracking:

1. Churn Rate: The Pulse of Customer Retention
The churn rate, the percentage of customers who cancel their subscriptions in a given period, is a crucial indicator of a SaaS company’s ability to retain customers and generate long-term value. A low churn rate suggests the company is providing value to its customers and keeping them engaged. In contrast, a high churn rate raises concerns about underlying issues that need attention.
Churn Benchmark & Example: SaaS benchmark: 5-7%, industry-dependent.
Example: CRM SaaS at 8% suggests onboarding or value enhancements.
Understanding Churn Rate:
- Analyze data for patterns and customer segments.
- Gather feedback to address issues and enhance satisfaction.
- Use predictive analytics for proactive customer retention.
Optimizing Churn Rate:
- Enhance Onboarding: Guide users for adoption.
- Exceptional Support: Offer responsive and empathetic service.
- Continuous Value: Introduce features for ongoing engagement.
- Customer Engagement: Foster community and loyalty.
- Monitor Usage: Track patterns for timely interventions.
SaaS companies can effectively retain customers, reduce revenue loss, and achieve sustainable growth by continuously monitoring, analyzing, and optimizing churn rates.
2. Monthly Recurring Revenue (MRR): The Financial Lifeline
MRR, the total recurring revenue generated each month from subscription plans, represents the financial lifeblood of a SaaS business. Tracking MRR growth clearly shows the company’s financial health and identifies opportunities to expand the customer base and boost revenue.
Benchmark: A healthy MRR growth rate is typically between 10% and 20% monthly.
Example: A project management SaaS company with $1 million monthly recurring revenue (MRR) is projected to reach $1.4 million in six months with a 15% monthly growth rate. This signals a positive trajectory and significant growth potential.

3. Average Revenue Per User (ARPU): Maximizing Customer Value
ARPU, crucial for SaaS, reflects average revenue per user over a specific period—usually monthly or annually. It unveils insights into customer base profitability, showcasing how effectively a company monetizes its offerings.
Benchmark: ARPU benchmarks vary by industry, product, and target market. SaaS businesses serving enterprises may have higher ARPUs than those serving individuals. A rule of thumb is to aim for an ARPU at least 3-5 times the cost of acquiring a new customer (CAC). This ensures revenue per customer sufficiently covers their development cost.
Example: A SaaS company providing email marketing software maintains an ARPU of $50 per month. With a customer acquisition cost (CAC) of $20 per customer, the company’s ARPU surpasses its CAC by 2.5 times. This indicates effective monetization and a robust return on investment in customer acquisition.
Optimizing ARPU:
- Evaluate pricing models with tiered plans, considering feature usage, user segments, or subscription duration to meet customer needs and maximize revenue. Promote complementary products or services through cross-selling and upselling to existing customers, encouraging upgrades and boosting revenue
- Analyze customer data to prioritize development efforts, aligning product enhancements with customer needs for ARPU growth.
- Segment customers based on usage patterns or demographics for targeted marketing, increasing adoption of higher-value plans. Provide additional services like consulting or training to enhance the overall customer experience beyond the core product.
Continuous monitoring and optimization of ARPU empower SaaS companies to maximize customer base profitability, drive revenue growth, and attain financial objectives.
4. Customer Lifetime Value (LTV): The Long-Term Impact of Customer Relationships
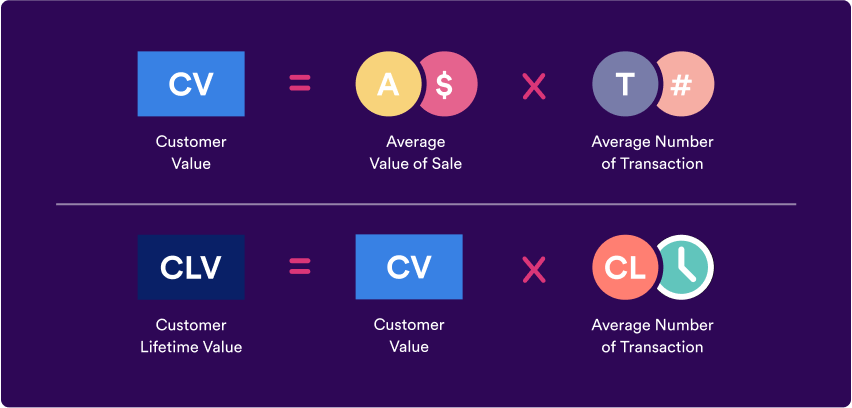
Lifetime Value (LTV) is pivotal for a SaaS business, reflecting a customer’s total revenue over their lifetime. A high LTV signifies successful acquisition and retention of valuable customers, making substantial contributions to the bottom line.
Benchmark: LTV benchmarks vary depending on the industry and product type. However, a general guideline is to aim for an LTV at least 3-5 times higher than the CAC.
Example: A SaaS company offering enterprise software boasts an LTV of $10,000 per customer. With a CAC of $2,000 per customer, the company’s LTV exceeds CAC by fivefold. This highlights the acquisition and retention of high-value customers, ensuring substantial long-term revenue.

5. Customer Acquisition Cost (CAC): The Price of New Business
CAC (Cost of Acquiring a Customer) reflects the investment in marketing, sales, and onboarding for acquiring new customers. It covers expenses such as marketing campaigns, advertising, sales salaries, and onboarding materials. Understanding CAC is vital for assessing the efficiency of customer acquisition, ensuring that the cost does not exceed the revenue generated.
Benchmark: CAC benchmarks vary across industries and products. A general guideline is to maintain CAC below 30% of LTV. For efficient customer acquisition, aim for a lifetime value of at least $3 for every $1 spent. A higher CAC-to-LTV ratio signals inefficiency, indicating a need for optimization in customer acquisition efforts.
Example: A SaaS company offering social media marketing software has a CAC of $100 per customer and an LTV of $500 per customer. This results in a CAC-to-LTV ratio of 20%, indicating effective customer acquisition at a sustainable cost.
Optimizing CAC:
- Target the Right Audience: Focus marketing on ideal customer personas for efficient resource use.
- Streamline Sales Process: Identify and reduce bottlenecks in the sales process.
- Enhance Onboarding: Optimize onboarding for quick customer engagement.
- Leverage Customer Referrals: Encourage satisfied customers for cost-effective referrals.
- Optimize Marketing Campaigns: Analyze campaigns for effective and cost-efficient strategies.
By continuously monitoring and optimizing CAC, SaaS companies can ensure that their customer acquisition efforts are efficient, sustainable, and aligned with their overall growth objectives.
6. Trial Conversion Rate: Turning Free Trials into Paying Customers
The trial conversion rate indicates how well a SaaS company converts free trial users into paying customers. A high rate reflects effective product value communication, while a low rate signals potential issues in the trial experience or pricing structure.
Benchmark: A typical trial conversion rate for SaaS businesses is 10% and 20%.
Example: A SaaS company offering e-learning software has a 12% trial conversion rate, aligning with benchmarks. To enhance conversion, personalized onboarding and additional support during the trial period could be beneficial.
7. Freemium Conversion Rate: Unlocking Revenue from Free Users
In the freemium model, the freemium conversion rate measures the percentage of free users who upgrade to a paid subscription. A high freemium conversion rate suggests that the freemium model effectively attracts users and provides enough value to encourage them to pay for the entire product experience.
Benchmark: A typical freemium conversion rate for SaaS businesses is 2% and 5%.
Example: A SaaS company that provides project management software has a freemium conversion rate of 3%. The company could increase its conversion rate by offering more compelling features or benefits for upgrading to a paid plan.
8. Net Promoter Score (NPS): The Voice of Your Customers
NPS, a gauge of customer loyalty and advocacy, is derived from customers’ likelihood to recommend a SaaS product. A high NPS reflects a satisfied and loyal customer base willing to endorse the product to others.
Benchmark: A typical NPS for SaaS businesses is between 30 and 70.
Example: A SaaS company that provides design software has an NPS of 65. This indicates that the company has a loyal customer base who are enthusiastic about its product. The company can continue cultivating customer loyalty by providing ongoing support, offering new features and enhancements, and fostering a positive community around its creation.


